Curves Ahead: Enhancing the Steering Law for Complex Curved Trajectories | CHI'25 Best Paper
During my time at the HCT lab, I worked on projects in various fields before settling on human performance modelling. This multi-year project drew from many aspects of my skillset, including mathematical reasoning, user study design, UI/UX design, web development, data collection and processing, statistical modeling, and academic writing, but also video editing, digital art and animations.
Ultimately, this culminated in the publication of our CHI 2025 paper, which received a Best Paper Award, and my thesis defense, which received a grade of 98%.
My work presents an extension of the classic Steering Law to better account for curved trajectories by introducing total curvature (K) in the movement time prediction equation.
Other contributions include a public dataset of a mouse-steering experiment conducted on 20 participants totalling 2700 trials, and a robust design framework for future steering experiments.
In this post, I will present a simplified summary of the motivation, design process and results of the project. More details can be found in the paper, the thesis dissertation, and the conference presentation.
Background and Motivation
The Steering Law is a well-known model used to predict how long it takes people to move through narrow paths when navigating user interfaces like when navigating to a specific option in a drop-down menu. However, the model assumes simple paths like smooth lines or circular curves, which do not fully represent the complex paths we encounter in real-world applications.
For instance, all 4 paths presented below have the same length, so according to the base Steering Law, they should all take the same amount of time to complete. However, if we tried to trace each of the paths with our finger or cursor, we would find that in practice, there is a difference in difficulty due to their differing shapes.
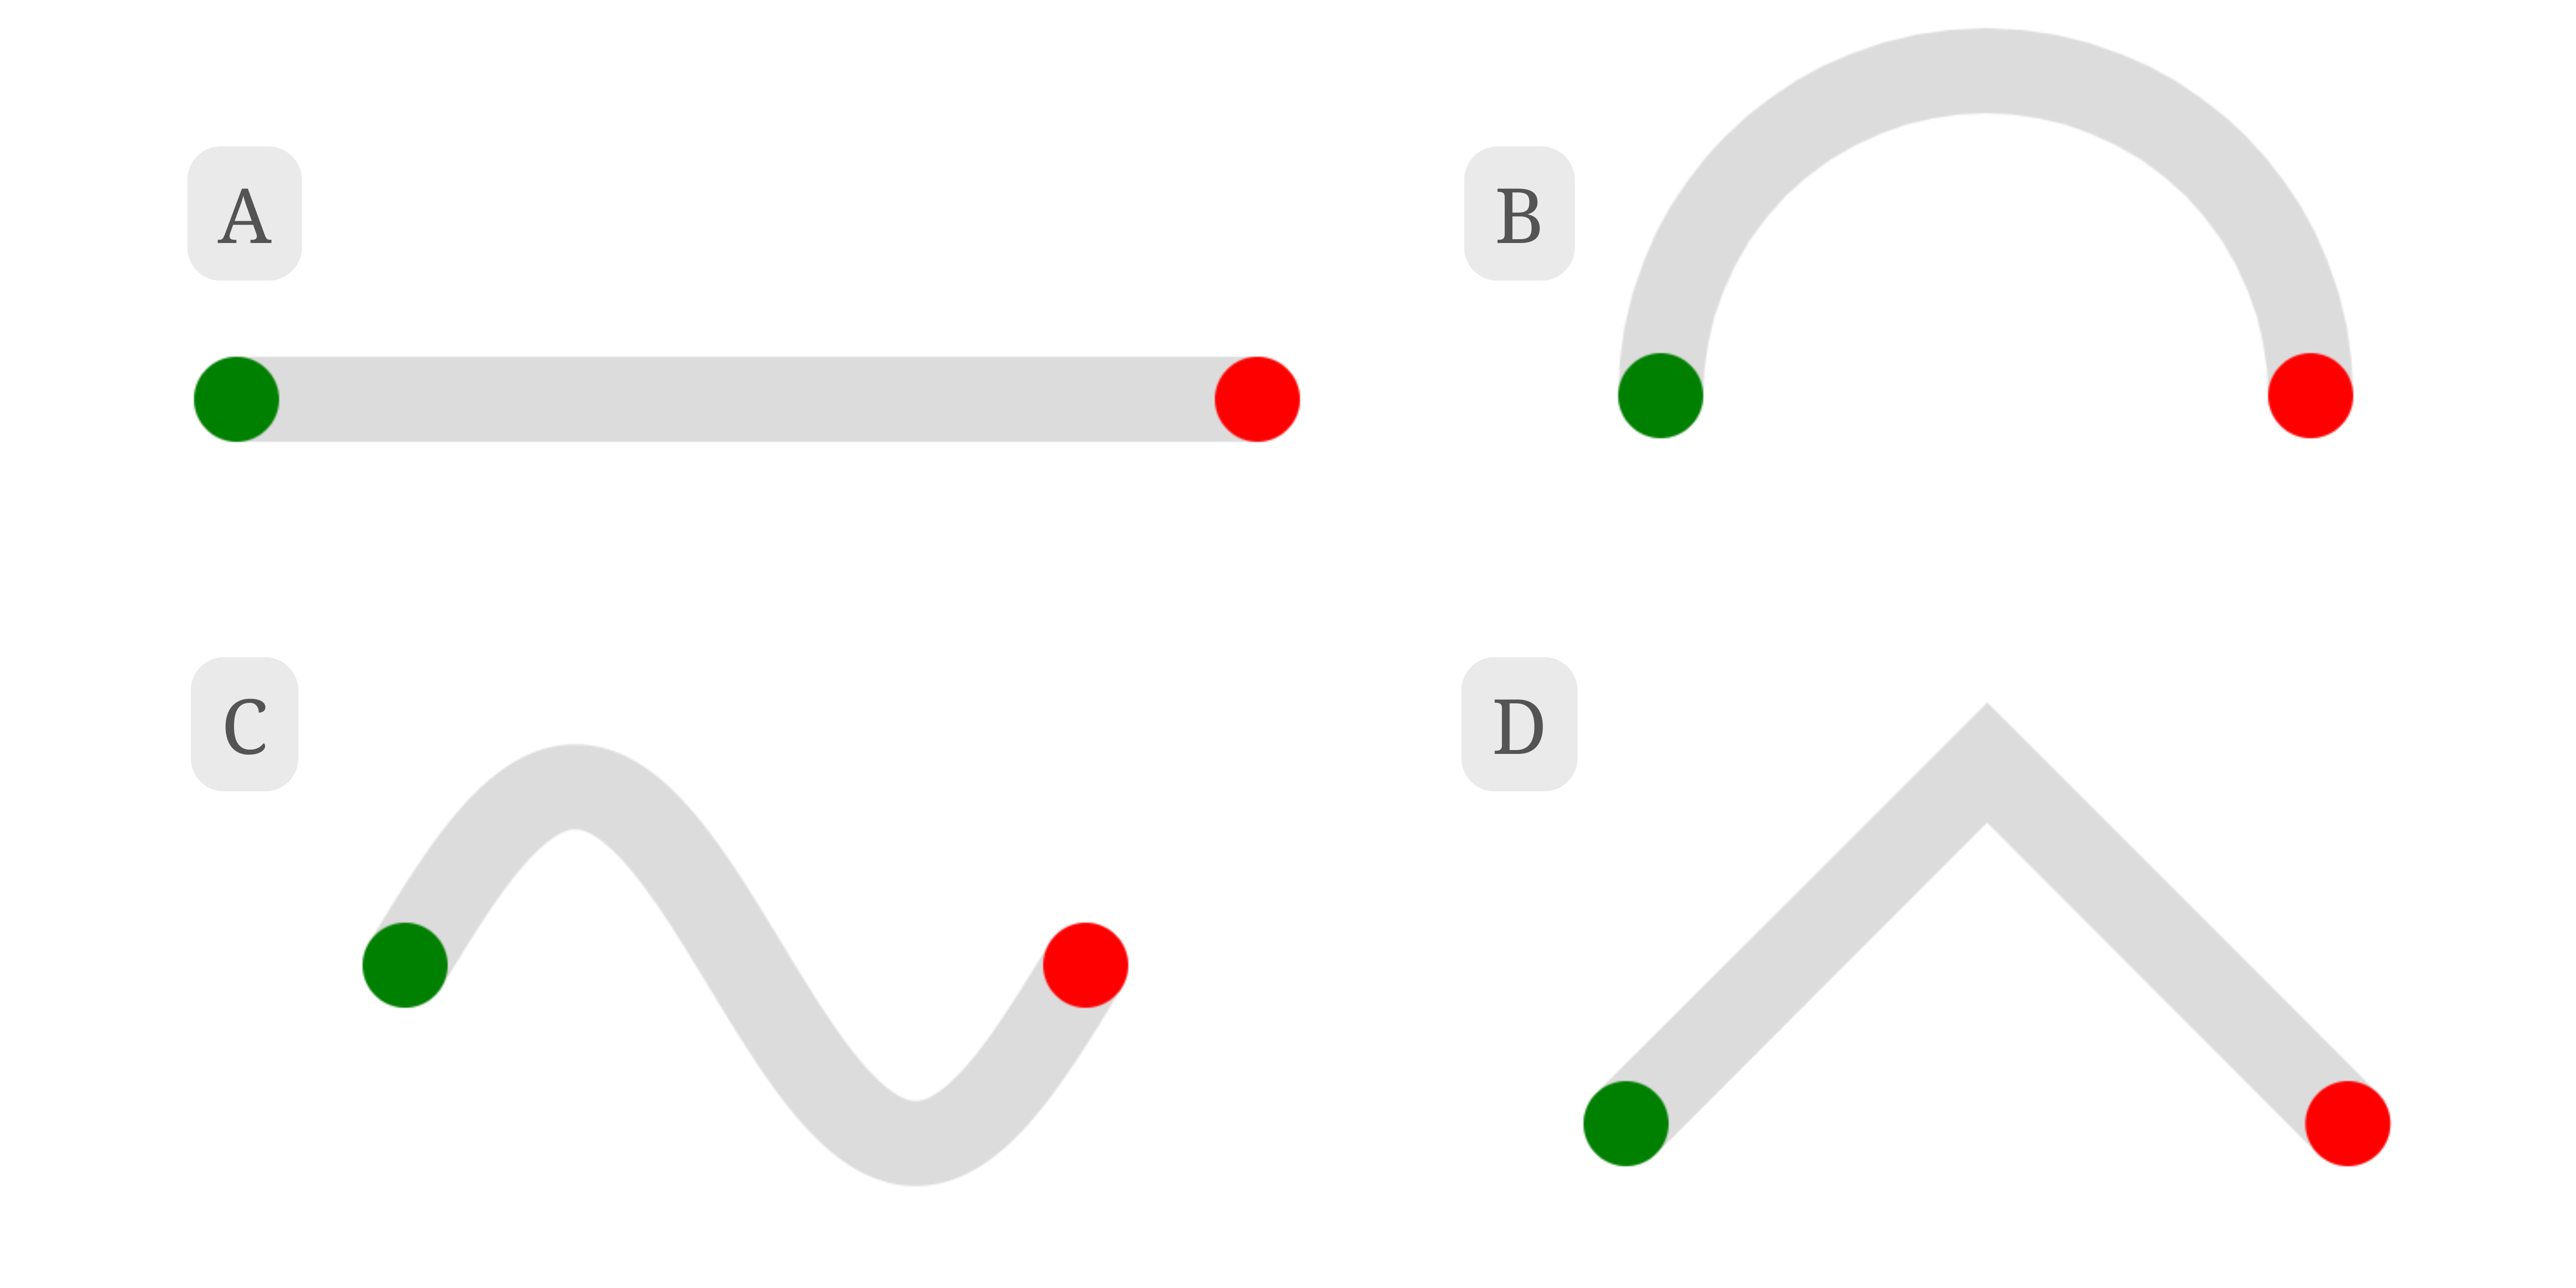
Intuitively, we understand that curvier paths would present an additional challenge over less curvy paths, but how do we quantify curviness? And once we know that, how do we account for it in the overall movement time prediction?
The ability to predict the movement time and evaluate the difficulty of arbitrarily curved paths would be helpful in determining level difficulties in video games, robotics, UX research, and could extend to helping us understand the complexities of other motor control tasks such as vocal articulatory trajectories and tongue movements during speech production
Experimental Design
To evaluate the impact of curvature on movement time, we designed a controlled experiment based on prior studies and iterative pilot testing.
Steering Task & Protocol
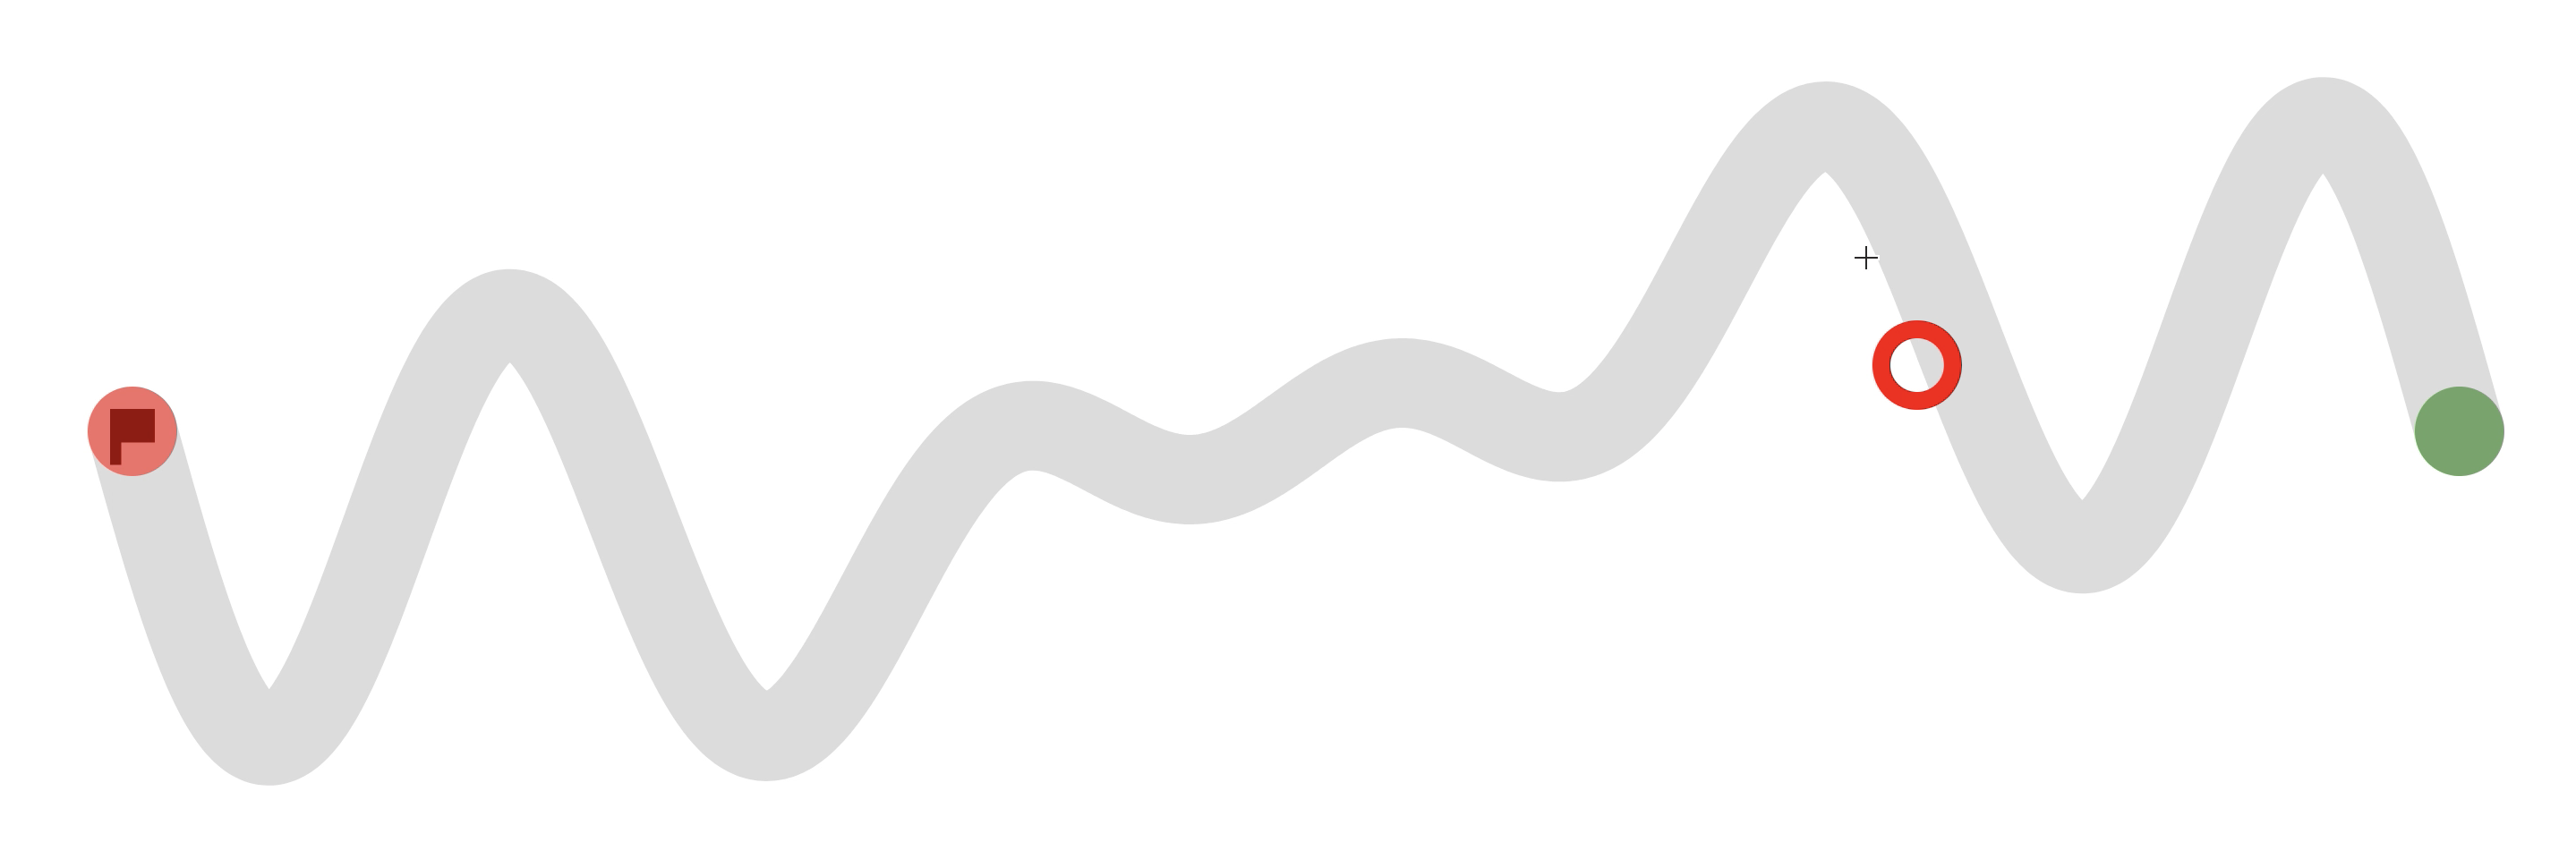
- Use the provided mouse to steer the cursor as quickly and as accurately as possible through the displayed tunnel
- 20 participants recruited from UBC campus
- Study divided into 2 stages:
- Tutorial: Error feedback, must reach passing criterion before proceeding
- Experiment: Data collection
- 3 levels of Width x 3 levels of Length = 9 conditions
- Each condition repeated 15 times, divided into 3 blocks
- Total of 27 blocks, randomized and reversed for half of the participants, 15s break between blocks
- Orientation of trials is pre-randomized
- Width of all trials fixed at 50 px
Total Curvature Parameter K
To account for the overall curviness of a path, we introduce the total curvature parameter K, computed as:
$$ K=\int_C|\kappa(s)|ds $$
where κ(s) represents the instantaneous curvature at any point s along path C.
Essentially, K is the total ‘amount’ of curvature over the entire experiment path.
Setup and Acquisition
- Setup on MacBook Pro with 2560 x 1600 px display and 3200 dpi mouse
- Mouse movements polled and interpolated using cubic splines during post-processing
- Custom experiment software for data acquisition:
- Implemented in JavaScript (Node.js)
- Trial data captured on the client-side, stored in temporary variables, then formatted and transmitted to the server for storage into participant-specific CSV logs
Curve Generation and Selection
- Experiment paths are represented by sums of sinusoidal functions
- A custom software was developed to visualize the effects of manipulating each of the parameters used in the curve’s construction (amplitude, number of sines, number of periods, etc.)
- To find candidates for potential paths, I performed a grid search over the parameters to numerically find the value for a desired K using the Newton-Raphson method

Design Justification
In total, 8 rounds of pilot testing were conducted to refine the experimental setup. I will briefly describe the process here. More details can be found in Chapter 3.2 of the thesis.
A) Choice of Curviness Parameter
Initially, the energy (E) of the curve was considered as a measure of curviness under the assumption that high frequencies introduce more rapid directional changes in the curve. This would make the generated paths subjectively curvier.
However, through mathematical analysis and Pilot Rounds 6 to 8, we found that there are no significant differences in movement times across different E levels.
B) Choice of Length and Width
Pilot Round 1 was used to determine the appropriate width (50 px) that did not cause excessive difficulty but was not too easy as to introduce ballistic behavior.
The length of the experiment paths had to be sufficiently long to ensure that the steering portion of the task dominates the overall user movement. The range of this value was determined in Round 2 of pilot testing.
C) User Interface Elements
UI elements are chosen and refined through observations and comments obtained during Pilot Testing as well as past studies.
- Endpoint buttons: colored (red and green) and contain icons to make accessible for colorblind participants
- Audio and visual feedback: as opposed to past Fitts’/Steering Law studies, these were omitted in consideration of users who may be colorblind or hard of hearing and to simplify the interface. The only visual feedback is given during the Tutorial phase in the form of error circles. However, this is only for learning purposes.
- Task instructions: considerations included user distraction, clarity, placement location, landing page, speed vs accuracy biasing, experimenter biasing, etc.
Experimental Protocol
- Movement reciprocity: enabled in order to be consistent with the original Fitts’ experiment, to balance for the handedness of the participant and to balance for the differences in movement mechanics from left-to-right and vice-versa
- Trial order and balancing: the randomization scheme as well as the number of blocks/trials were determined through Pilot Rounds 6 and 7
- Trial orientation: some trials are flipped horizontally to reduce repetition and increase variation in subsequent tests from an observation made during Pilot Round 2
Participant-Related Issues
- Fatigue: this influenced the total number of trials, the duration of the tutorial, the introduction of a break between blocks and trials
- Comfort: to prioritize this, participants were allowed to adjust their seat and viewing angle. Participant comfort also influenced the fixed mouse sensitivity, addition of a mousepad, etc.
- Practice: we noticed during Round 3 that there is a learning trend exhibited by participants as they progress through the experiment. The addition of a tutorial was added to reduce the effect. However, we found that although it stabilizes the fluctuations in performance seen in earlier trials, the tutorial was still not sufficient at training participants up to expert level. We could not increase the number of trials in the tutorial due to lack of time and consideration for the participant’s comfort/fatigue. We refined the tutorial to filter out participants who are below a certain level of expertise and movement time stability.
Results
We found the following effects by performing ANOVA on the data obtained during the trials:
| Movement Time (MT) | Out of Path Movement (OPM)* | Average Speed (Vavg) | |
|---|---|---|---|
| Length (L) | ✓ | ✓ | x |
| Curviness (K) | ✓ | ✓ | ✓ |
| Interaction (LxK) | ✓ (small) | x | ✓ |
*We define OPM as the the percentage of sampled points that fall outside the boundaries of the drawn tunnel. This allows us to examine the effects of the path parameters on the error rate.
From the results of the user study, we can note that as expected, the curviness of the path affects users’ steering behavior. This motivates the need to extend the Steering Law to include it as a factor in the overall movement time prediction function.
Modeling
We propose the following extension to the base Steering Law to account for the effects of K as well as the interaction between L and K:
$$ MT = a+b L+c ·log_2(K +1) +d L ·K $$
We compared the fitness of our proposed model with the base Steering Law model, as well as past proposed models adapted to be compatible with our experiment paths.
First, we found that models augmented with K outperform the base model and improve the movement time prediction ability in terms of AIC and r-squared value.
We also found that the addition of an interaction form significantly enhances the model accuracy. To ensure that this is not simply due to overfitting, we confirmed this with cross-validation RMSE.
Conclusion
This study demonstrated that the inclusion of K improves model fitness, as indicated by the higher adjusted r-square value, as well as lower AIC and RMSE values when fitted and cross-validated on the data. We suggest and extended form of the base Steering Law for predicting movement time, which includes a significant interaction term L·K between path length and curviness. In addition, we also describe a robust study design for future steering experiments.
Fun
And lastly, please enjoy this animation I made to introduce the idea behind the whole project. This was drawn frame-by-frame in Procreate.